Registered Nurse Salary in Norwich, CT: $106,711 (2026)
Quick Answer:A full-time registered nurse in Norwich, CT earns a median $106,711/year (≈ $51.31/hour) in nominal terms for 2026 — projected from BLS OEWS 2025 (SOC 29-1141). Once you factor in Norwich's price level (0% above national, BEA RPP 100.4), that paycheck buys what $106,238 would nationally. Nominal pay sits 0.4% below the Connecticut state average.
Official BLS data · View source
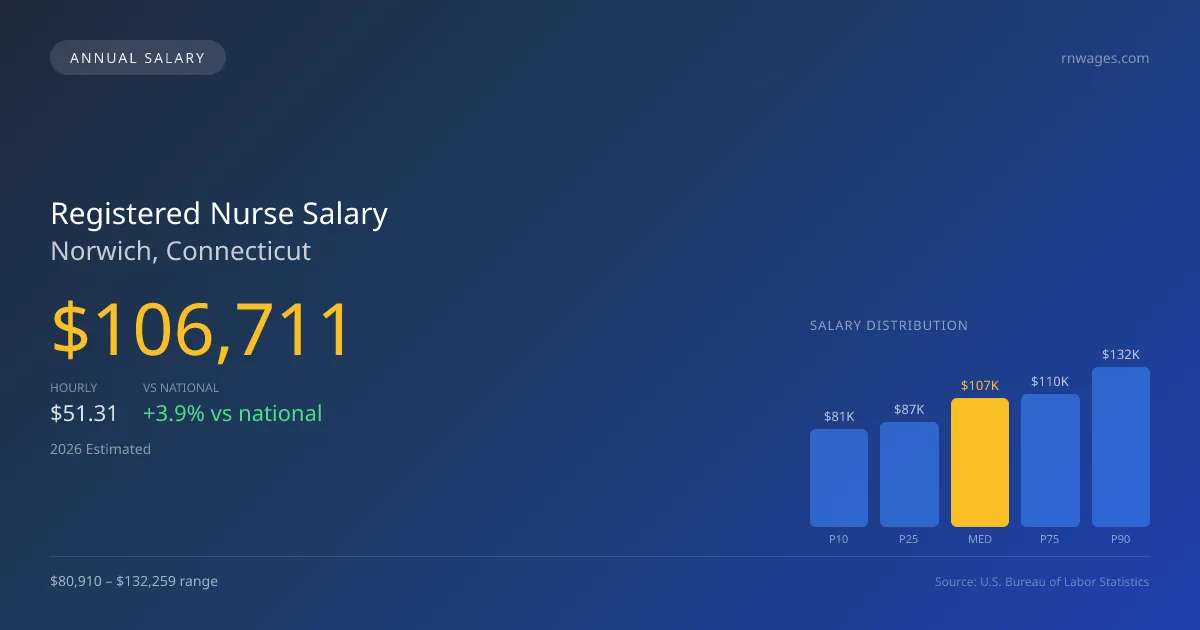
Registered nurses in Norwich, Connecticut, can anticipate a median annual salary of $106,711 in 2026, which reflects a 3.88% increase compared to the national median of $102,730 for the same year. The compensation range for RNs in this area spans from $80,910 at the 10th percentile to $132,259 at the 90th percentile, highlighting a significant potential for earnings depending on experience, specialty, and work setting. These figures are derived from the official BLS OEWS surveys and underscore the distinct pay dynamics between staff and travel nurses, the latter often commanding higher rates due to urgency and short-term contracts. This competitive pay framework marks Norwich as a potentially attractive market for both prospective RNs and those considering travel assignments, especially amidst a growing need for educated and skilled nursing professionals.
Salary Breakdown
| Percentile | Annual | Hourly |
|---|---|---|
| Entry Level (P10) | $80,910 | $38.90 |
| Lower Range (P25) | $86,607 | $41.64 |
| Median (P50)(typical) | $106,711 | $51.31 |
| Upper Range (P75) | $110,154 | $52.96 |
| Top Earners (P90) | $132,259 | $63.59 |
Median Salary Position
3.88% above the national average
2026 Salary Percentile Distribution in Norwich
In Norwich, CT, the registered nurse salary spread from the 10th to 90th percentile is $51,349 (2026 est.). At $106,711, the local median is 3.88% above the national median of $102,730.
Salary Calculator
At 40 hours/week in Norwich: You'd be above the median
How Norwich Registered Nurse Pay Compares
Norwich median: $106,711/year (2026)
| Compared To | Median Salary | Norwich Pays |
|---|---|---|
| Connecticut Average | $107,139 | -0.40% less |
| National Average | $102,730 | +3.88% more |
Registered Nurses in Norwich, CT earn a median of $106,711 per year (2026 est.), which is 3.88% higher than the national median of $102,730 and 0.40% below the Connecticut state average of $107,139.
Cost-of-Living Adjusted Salary
Norwich has a cost of living 0.44% above the national average.
Adjusted salary = nominal × (100 / CoL index). CoL index: 100 = national average.
Norwich, CT has a cost-of-living index of 100.445 (above the national average of 100). While the nominal salary of $106,711 is competitive, the higher cost of living reduces purchasing power to an effective $106,238 — a 0.44% reduction.
Compare Purchasing Power
Select a city to see how your salary compares after cost of living
Select a city above to compare purchasing power
2019 BLS Actual
$82,310
2025 BLS Actual
$101,330
2026 Current Est.
$106,711
2019–2027 Growth
+36.5%
Salary Trajectory for Registered Nurses in Norwich (2019–2027)
2019–2025: actual BLS OEWS data for this metro area. 2026+: CAGR 5.31% projection.
| Year | Annual Salary | Status |
|---|---|---|
| 2019 | $82,310 | Actual |
| 2020 | $82,990 | Actual |
| 2021 | $92,870 | Actual |
| 2022 | $95,590 | Actual |
| 2023 | $101,800 | Actual |
| 2024 | $100,840 | Actual |
| 2025 | $101,330 | Actual |
| 2026(current) | $106,711 | Estimated |
| 2027 | $112,377 | Projected |
Based on 7 years of BLS OEWS data for the Norwich metropolitan area, the median registered nurse salary grew 23.1% from $82,310 (2019) to $101,330 (2025). At a 5.31% compound annual growth rate, salaries are projected to reach $112,377 by 2027 — a total increase of $30,067 (36.53%) from 2019.
Note: Historical values (2019–2025) are actual BLS OEWS figures for the Norwich metropolitan area, sourced from annual Occupational Employment and Wage Statistics surveys. 2026–2026 figures are current estimates, and 2027 values are projections, calculated using a 5.31% CAGR derived from 7-year BLS historical data. Actual salaries may vary based on employer, experience, certifications, and local market conditions.
Salary by Experience Level
| Experience | Estimated Salary Range |
|---|---|
| 0-2 years (New Graduate) | $80,910 – $86,607 |
| 3-5 years (Mid Career) | $86,607 – $106,711 |
| 5+ years (Experienced) | $106,711 – $110,154 |
| 10+ years (Top Earner) | $110,154 – $132,259 |
RN salary ranges estimated from BLS percentile data. Individual registered nurse compensation varies by employer, certifications, and specialization.
Registered Nurse Job Market in Norwich
With approximately 2,460 registered nurses currently employed in Norwich, the local job market reflects a strong demand driven by various healthcare settings, including acute care hospitals, outpatient clinics, and home health agencies. The cost of living index stands at 100.445, slightly above the national average, which can affect the purchasing power of nurses’ salaries. Employers with the highest pay typically include larger hospital systems, particularly those offering specialty care in areas such as the ICU and operating room. Factors like shift differentials for night and weekend shifts, specialty certification bonuses, and the prestige of working at Magnet-status hospitals contribute to the salary variance. For RNs aiming to maximize their earnings in this market, pursuing specialty certifications through organizations like the ANA or AACN, along with considering roles in higher-paying facilities or positions with on-call requirements, can be effective strategies.
More salary data for Norwich, CT:
Frequently Asked Questions
How much do registered nurses make in Norwich, CT in 2026?
Is Norwich, CT a good place to work as a registered nurse?
Can registered nurses make $100K in Norwich?
What is the cost-of-living adjusted registered nurse salary in Norwich?
How much does a registered nurse make per hour in Norwich?
Related Pages
Compare Salaries
Career Resources
Nearby Cities in Connecticut
Written by Jordan Lee, RN, BSN
Career Analyst
Jordan Lee has 10 years of experience as a registered nurse. Their specialty is pediatric nursing in a community hospital. They analyze nursing workforce trends and salary data.
Methodology & Data Source
Salary figures on this page are 2026 projections based on the Bureau of Labor Statistics Occupational Employment and Wage Statistics (OEWS) survey, May 2026 release. The BLS reported a median annual salary of $101,330 for registered nursesin the Norwich metropolitan area. A 5.31% compound annual growth rate (CAGR), calculated from 6-year national BLS wage trends, was applied to project current 2026 compensation. Percentile ranges (P10–P90) represent the full salary distribution across experience levels and practice settings in this market.
Data Sources & Methodology
Source: BLS, OEWS, 7-year dataset (–). Per-city data from annual BLS metropolitan area surveys.
2026 figures are projected from 2025 BLS data using a compound annual growth rate (CAGR) of 5.31%, derived from historical BLS wage trends for registered nurses (SOC 29-1141).
Compiled and verified by Jordan Lee, RN, BSN, a licensed registered nurse with 10+ years of clinical experience. · View source data at BLS.gov